
Dashboard
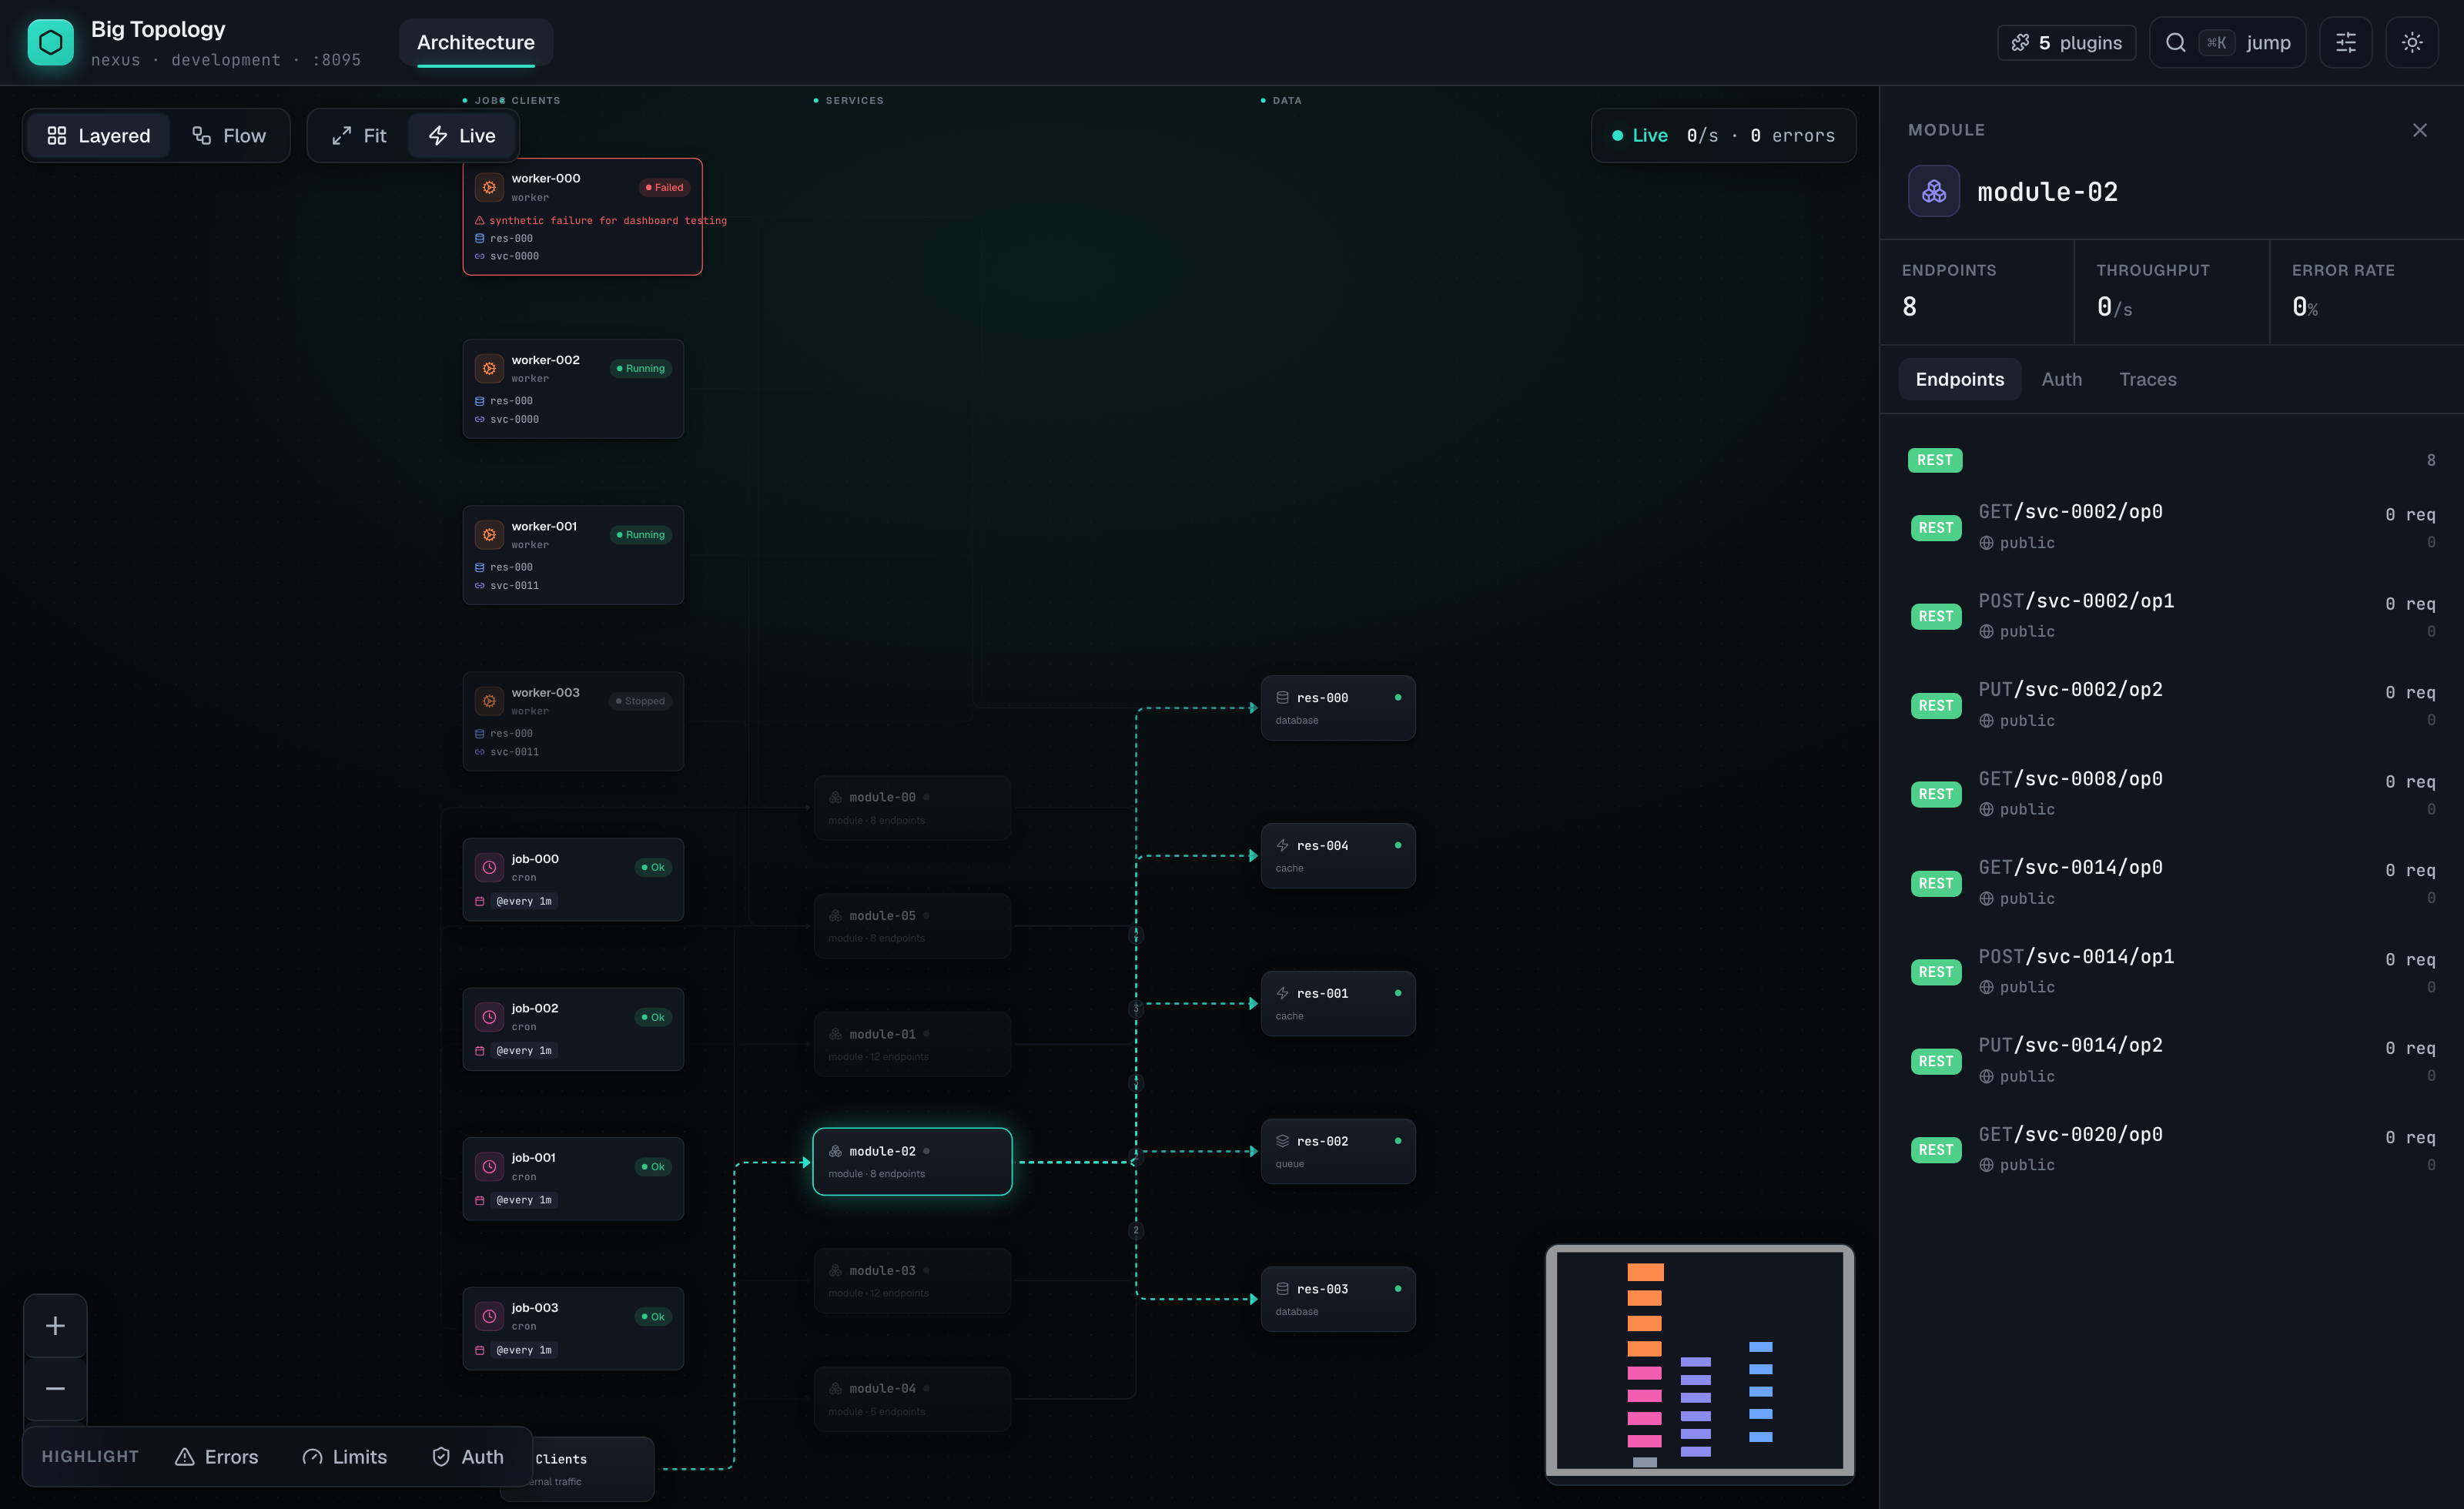
The dashboard at /__nexus is a live map of your app, built from what you registered. There is nothing to set up.
Tabs
The dashboard is a console in the style of a NiFi-like operations tool: a slate top bar with one tab per surface, a live status bar, and dense tables. It follows your light or dark preference.
| Tab | Shows |
|---|---|
| Architecture | Modules, endpoints, services, resources, workers and crons, with dependency edges. Drill into a module, pan the minimap, and watch live traffic pulse along the edges. It is built to stay readable with more than 1000 nodes. |
| Endpoints | Every REST route, GraphQL op and WebSocket message, scoped by a module (or service) rail and searched, sorted and paged on the server, so thousands of endpoints stay fast. Each endpoint has a page with its input schema, recent errors, an in-page tester, and its rate limit (editable live). |
| Services | Each service with its endpoint count, resources, dependencies and traffic. Sort by requests or errors to find the noisy ones. |
| Resources | Databases, caches, queues and disks with their health. Failing ones come first. |
| Workers & Crons | Worker status and last error; cron schedules, next and last runs, with run, pause and resume controls. |
| Traces | Recent requests from the trace buffer, searchable, with a waterfall per trace. |
| Auth | Cached identities, with invalidation by identity or token, and a live list of recent 401/403 rejections (reason, endpoint, identity), each linked to its trace. Shown when auth.Module is wired. |
| Runtime | The global middleware chain, plugins, the middleware catalogue and GraphQL document-cache stats. |
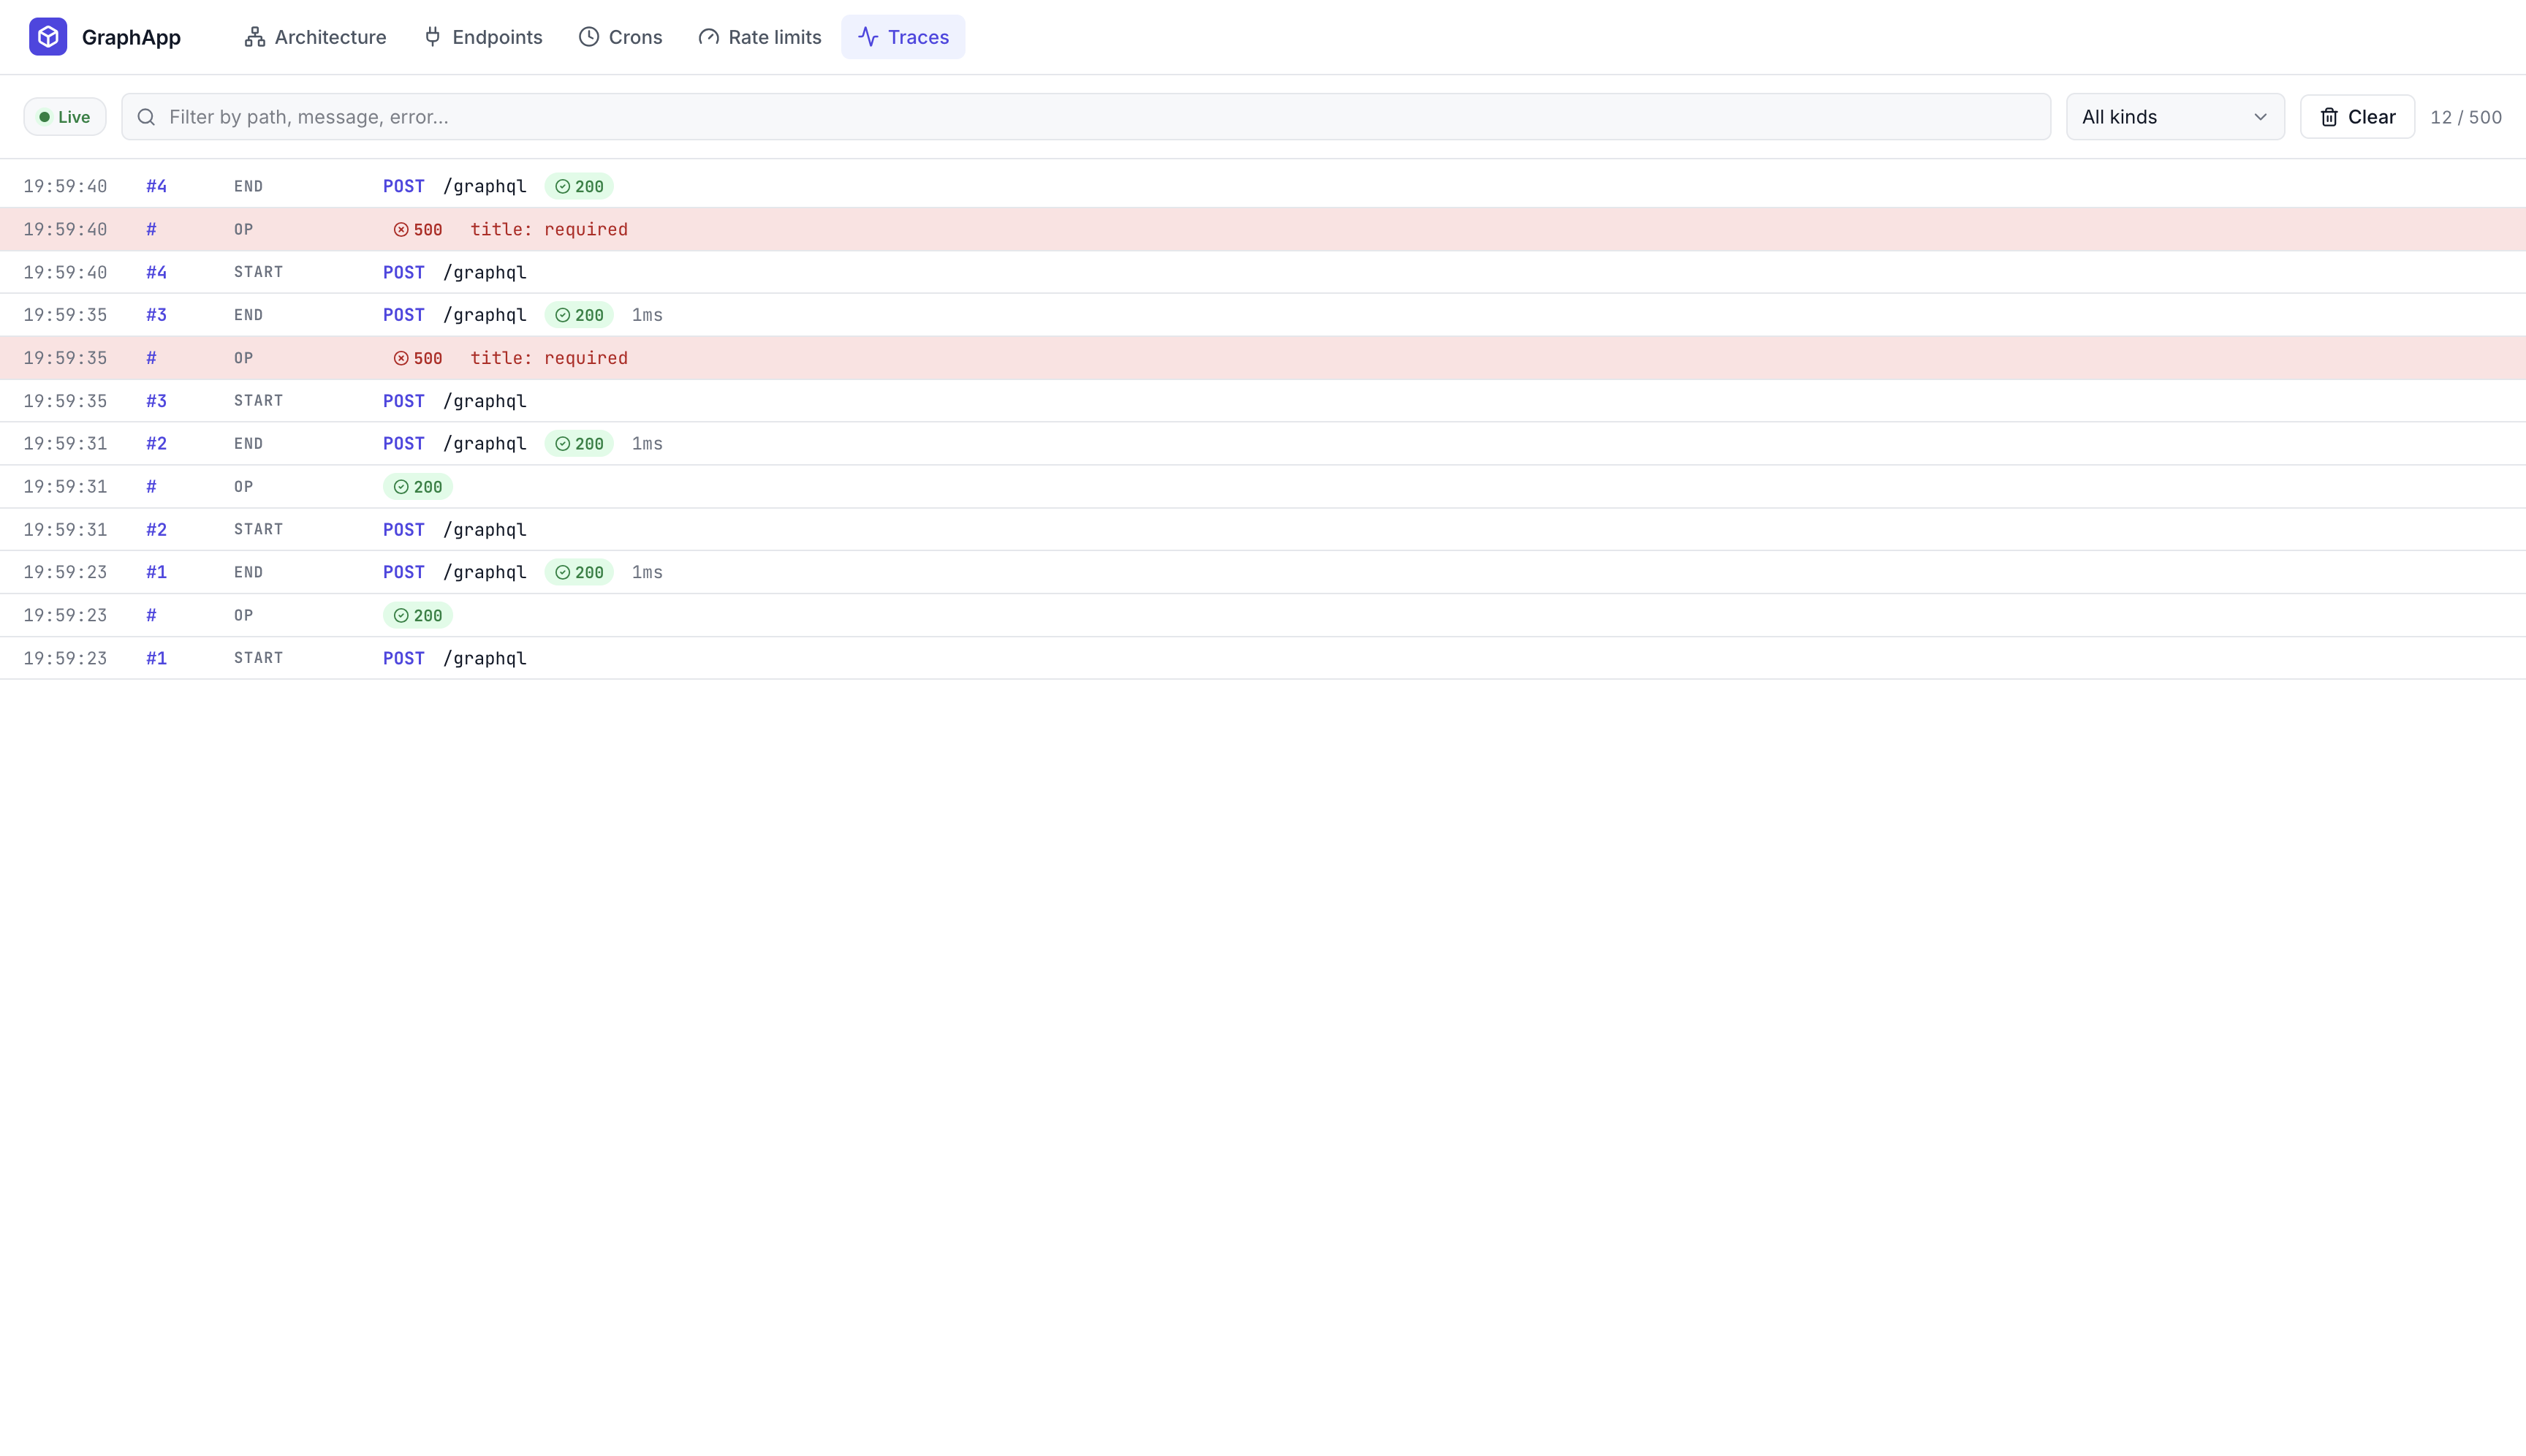
The dashboard is driven by WebSockets, not polling. /__nexus/live pushes a state snapshot when something changes, and the open tab re-renders in place (or gets a cheap 304 when nothing it shows has changed). /__nexus/events streams traces. Data is gathered only while a client is connected, so endpoints pay nothing per request.
Turning it on
The whole /__nexus surface, both the UI and its JSON APIs, returns 404 unless introspection is open. That keeps production binaries locked down by default.
[runtime]
introspection = true

[runtime.dashboard]
enabled = true
name    = "Shop"
nexus dev and the nexus new scaffold turn it on for development.
In production
Three ways to expose it safely, from narrowest to broadest:
A network allowlist. The dashboard is reachable from these networks even when introspection is off:
toml[runtime] introspection_networks = ["10.0.0.0/8"]A private listener. Serve admin routes on a separate address. See Deployment.
Your own middleware in front of the dashboard:
goconfig.Runtime{ Middleware: config.Middleware{ Dashboard: []middleware.Middleware{requireAdmin}, }, }
Hiding an endpoint
nexus.HideFromDashboard() removes an endpoint from the dashboard, its APIs and the graph. The route keeps serving normally.
nexus.AsRest("GET", "/internal/debug", NewDebug, nexus.HideFromDashboard())Extensions can add their own live state to the snapshot with dashboard.RegisterSnapshotExtra(name, fn).